Measurement Functions
Overview
Network measurement is instrumental to understanding network behavior, fault diagnosing, attack prevention and traffic engineering. While conventional measurement equipment/tools deliver basic network flow metrics (e.g. NetFlow[1], sFlow[2]), hardware and software built upon those are often proprietary and closed to extension. This imposes tremendous obstacles to satisfying emerging, on demand and ad hoc measurement demands. In addition, with the recent development of ultra high speed networks, the network line speed has reached 100Gbps and beyond[3]. To achieve scalable network measurement keeping up with the line rate has become increasingly important.
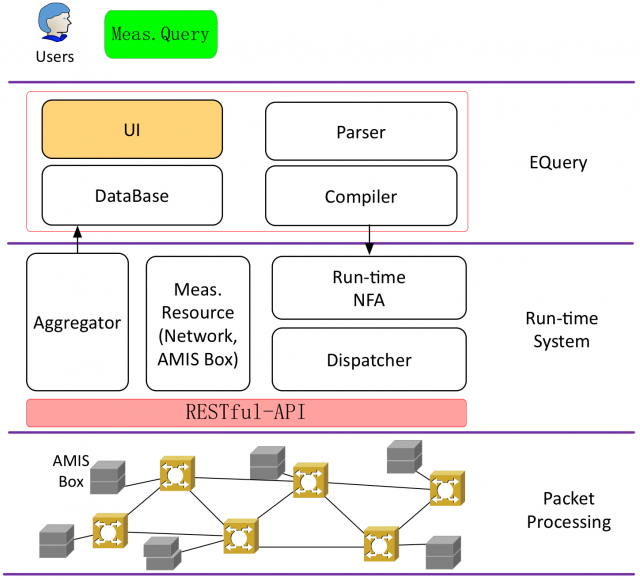
In AMIS project, as shown in the figure, we design the following two major parts to achieve composable and programmable measurement for 40/100 GbE network links using multicore processors.
Composable and Programmable Measurement Framework
Programmable Framework
We propose a Composable and Programmable Measurement Framework to provide high level abstractions for efficient measurement task definition and implementation. For that purpose EQuery, a language and associated toolset is designed for event-driven declarative queries in programmable network measurement. This query language supports both the specification of functionalities and temporal dependencies of measurement tasks and enables network monitoring and diagnosing effectively.
In our proposed framework, there are three major parts: EQuery, run-time system and packet processing in physical network.
EQuery
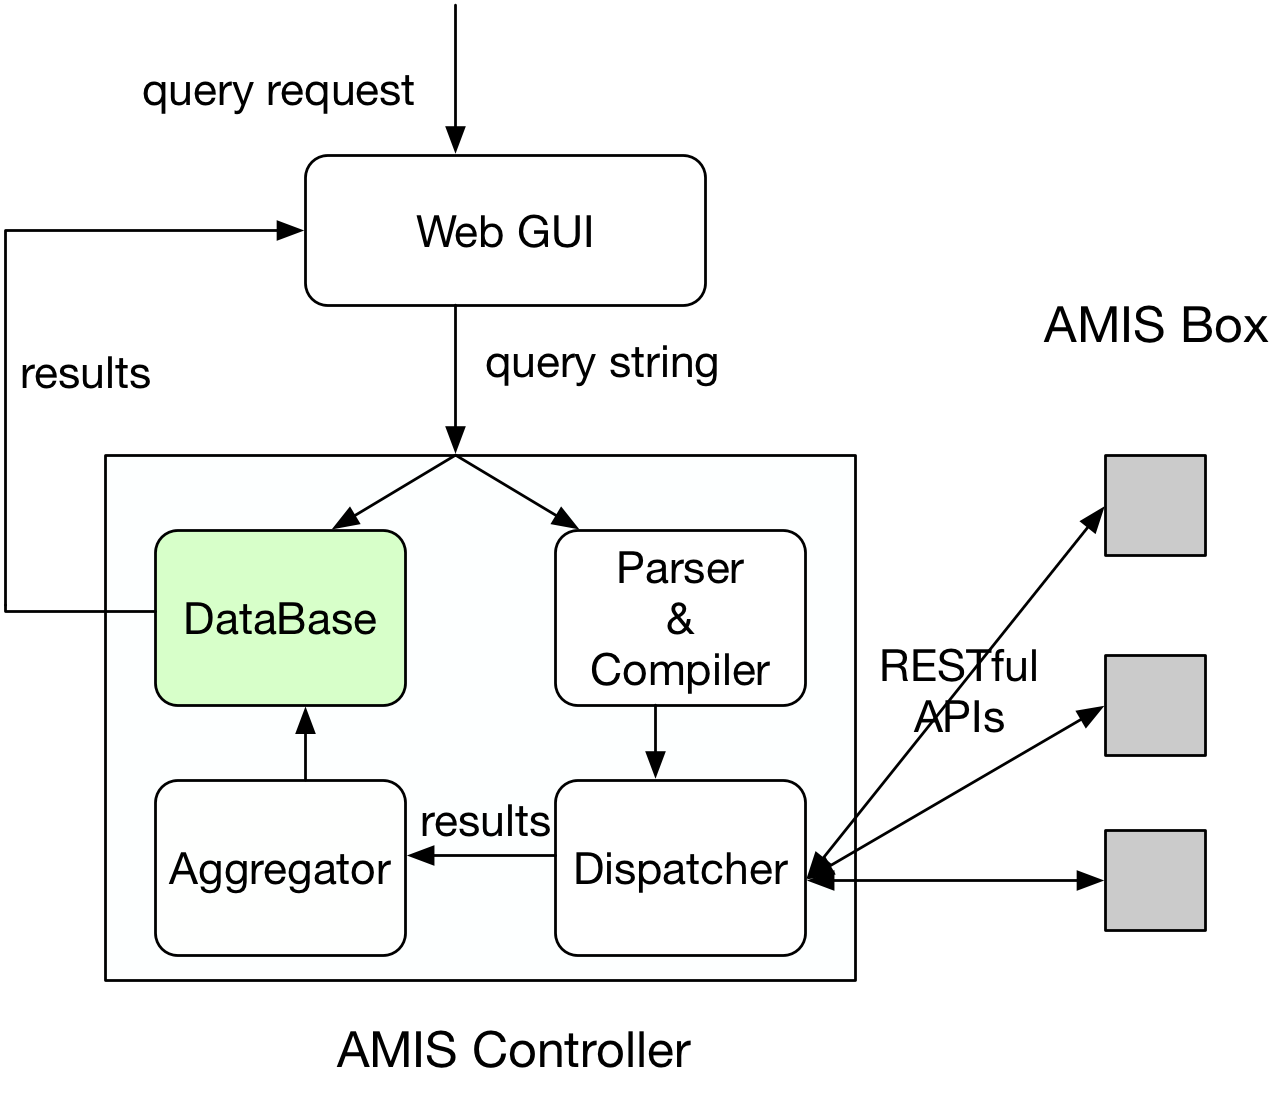
In this part, users (e.g. network operators, researchers, engineers) can submit a customized measurement query by using EQuery via a web GUI. This query then will be parsed and complied into network measurement primitives, which will be instantiated on AMIS boxes to collect network states. Once the results become ready in the database, they will be illustrated on the web GUI and will be refreshed in real-time when the results are updated.
Web GUI
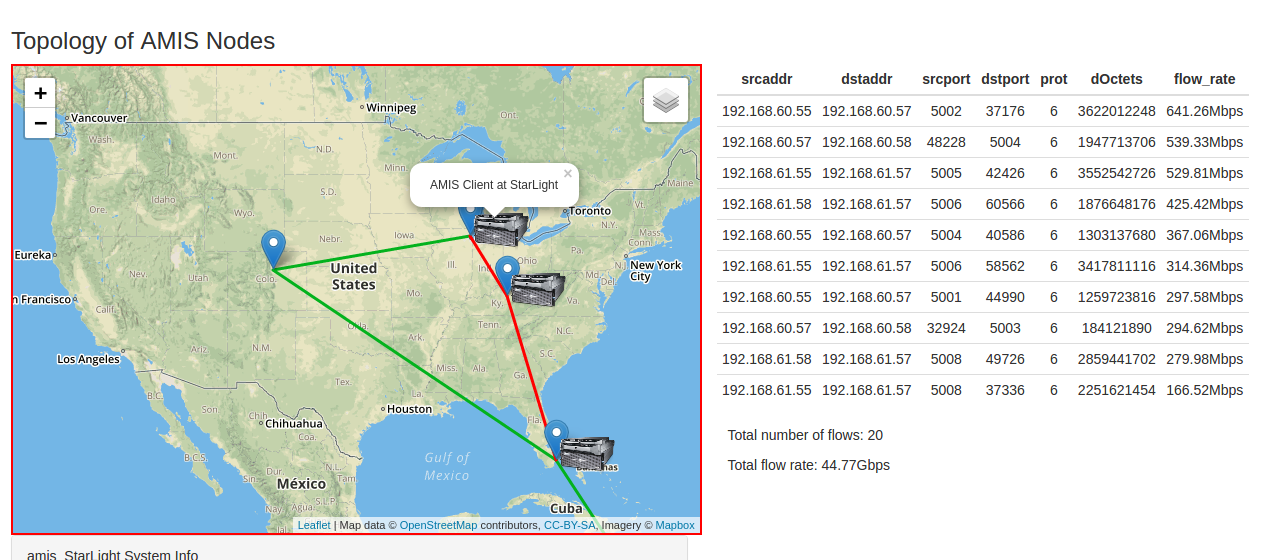
In this web GUI, users can submit query, check query result and monitor AMIS boxes operation status as well as flow statistics. In the backend, all the requests (query, operation status, flow statistics) will be arranged to different AMIS boxes by communicating with University of Kentucky’s plugin. The returned results from distributed AMIS boxes will be aggregated and then written into the database for showing on the web GUI. The picture in right shows the example of flow statistics from StarLight AMIS box.
Packet Processing in IRNC Networks
In physical networks, AMIS Boxes are deployed at the exchage points and network packets will be duplicated to AMIS Boxes via a switch mirror port or a Tap device. To spped up the packet processing, general-purpose x86 multicore processors and off-the-shelf 100 GbE NICs with the support of DPDK will be used on AMIS Boxes.
Work Flow of Measurement
EQuery Language
We argue that an “event” is fundamental in defining network measurement functions as well as meaningfully chaining them for extensibility. In AMIS project, we present EQuery, a language and associated toolset designed for event-driven declarative queries in programmable network measurement. This query language supports both the specification of functionalities and temporal dependencies of measurement tasks and enables network monitoring and diagnosing effectively. Specifically, the features of EQuery can be summarized as follows.
- support declarative query language to obtain network-wide information, including per-packet, per-flow, and per-link status;
- launch compositional queries and build “events” into the query language to trigger subsequent queries according to the occurrence of specified situations.;
- be independent of specified hardware;
- be compiled automatically into low-level rules and state variables.
EQuery Language Specification
We exploit and extend an SQL-like query language to collect network metrics. Our new language, called EQuery, can declaratively express what metrics should be measured, how to aggregate the data, and when to trigger subsequent measurement queries.
The syntax of EQuery is illustrated in the diagram where the new clauses are highlighted. There are 7 primary clauses in the first 7 lines, among which only the “Select” clause is mandatory. Here we briefly explain each of the clauses.
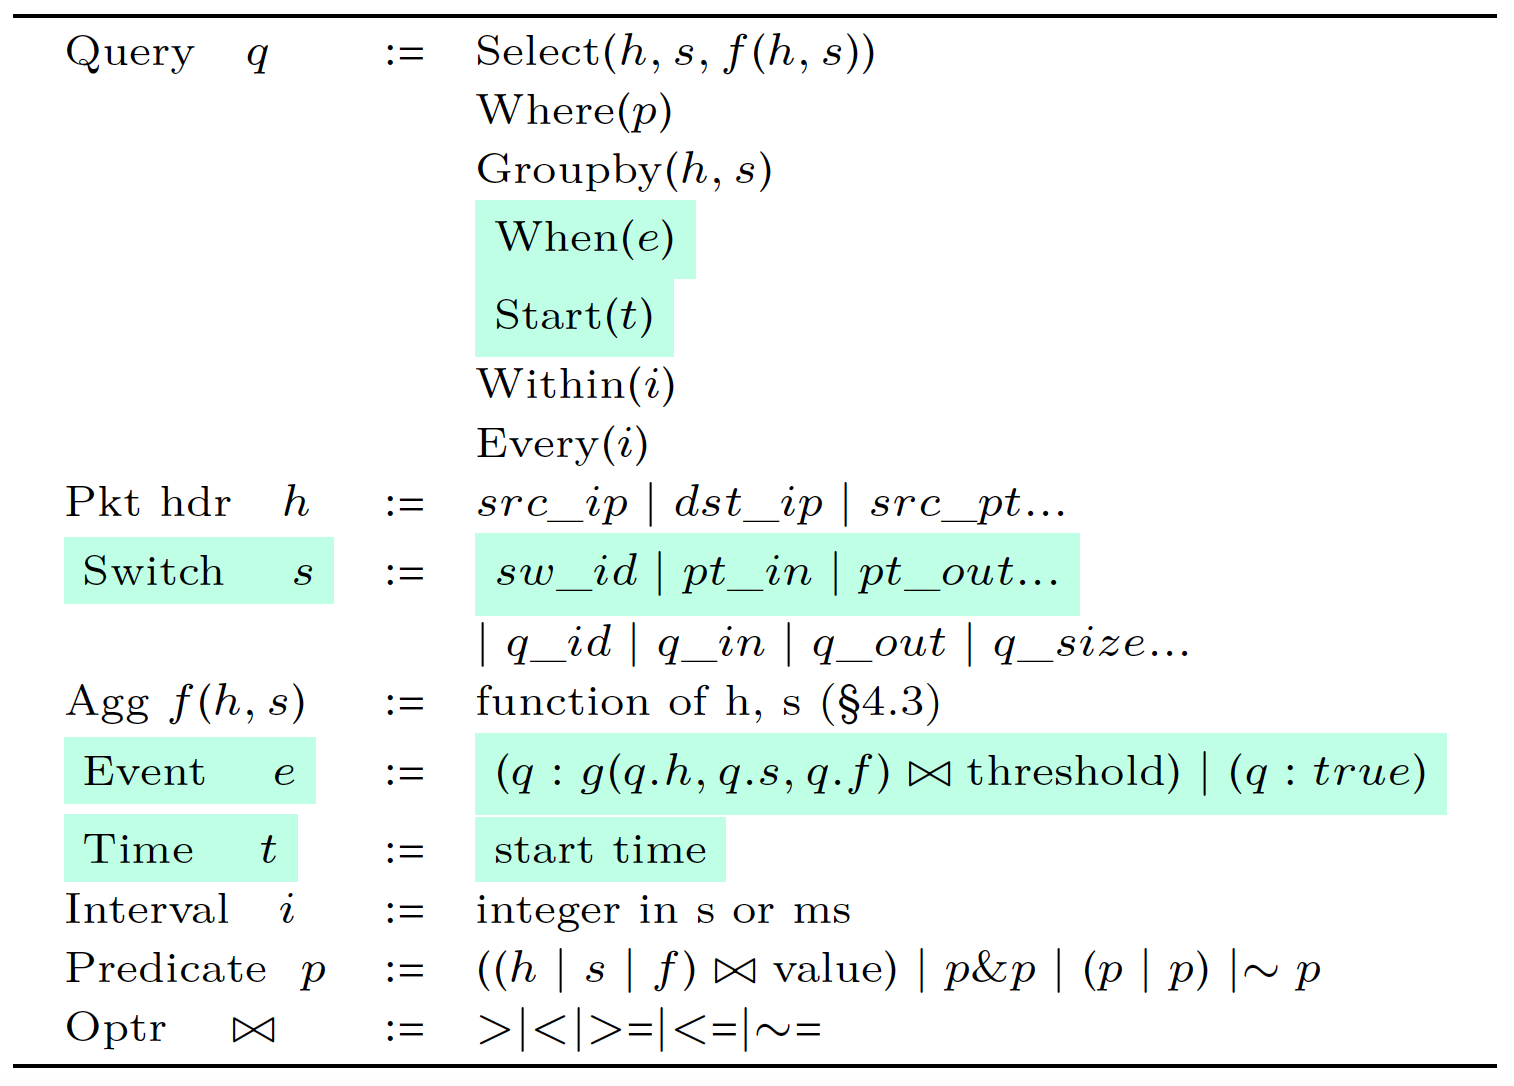
Select: A Select(h, s, f (h, s)) clause is used to express what data a network operator wants to query. Here the arguments are defined as “measurement fields”, including the fields of a packets header, h, the parameters of network devices, s, as well as the aggregated fields, f (h, s) (e.g. COUNT, SUM and customized aggregation fields).
| Where: A Where(p) clause applies the predicate p to filter the query results. Only those packets satisfying the predicate p will be analyzed for statistical purposes. The basic predicate uses the syntax ((h | s | f ) \bowtievalue) to test the selected measurement field. In this paper, a test on an aggregated field (f \bowtie value) actually imposes a test on a data plane state. “\bowtie” is a series of operators where “~=” indicates “unequal”. More complicated filtering predicates can be constructed using natural set-theory operations such as intersection (p&p), union (p | p) and complementation (~p). |
Groupby: A Groupby(h, s) clause can be used in a “Select” statement to collect measurement data across multiple records and group the results by one or more columns (h, s). The “Groupby” clause is often combined with aggregate functions.
When: A When(e) clause is employed to impose a trigger on a query. A query driven solely by a “When” clause will be executed once event e occurs.
Others: A Start(t) clause indicates that the start time of the submitted query is t (in date time format). The default value is the time when the query is submitted. A Within(i) clause specifies the maximum execution time for a query. An Every(i) clause groups packets that arrive within the same time window, where i can be specified in seconds or microseconds. In turn, the results will be returned every i seconds (or microseconds). The “Every(i)” clause is also used to express a periodic event (PE) in a query.
Example
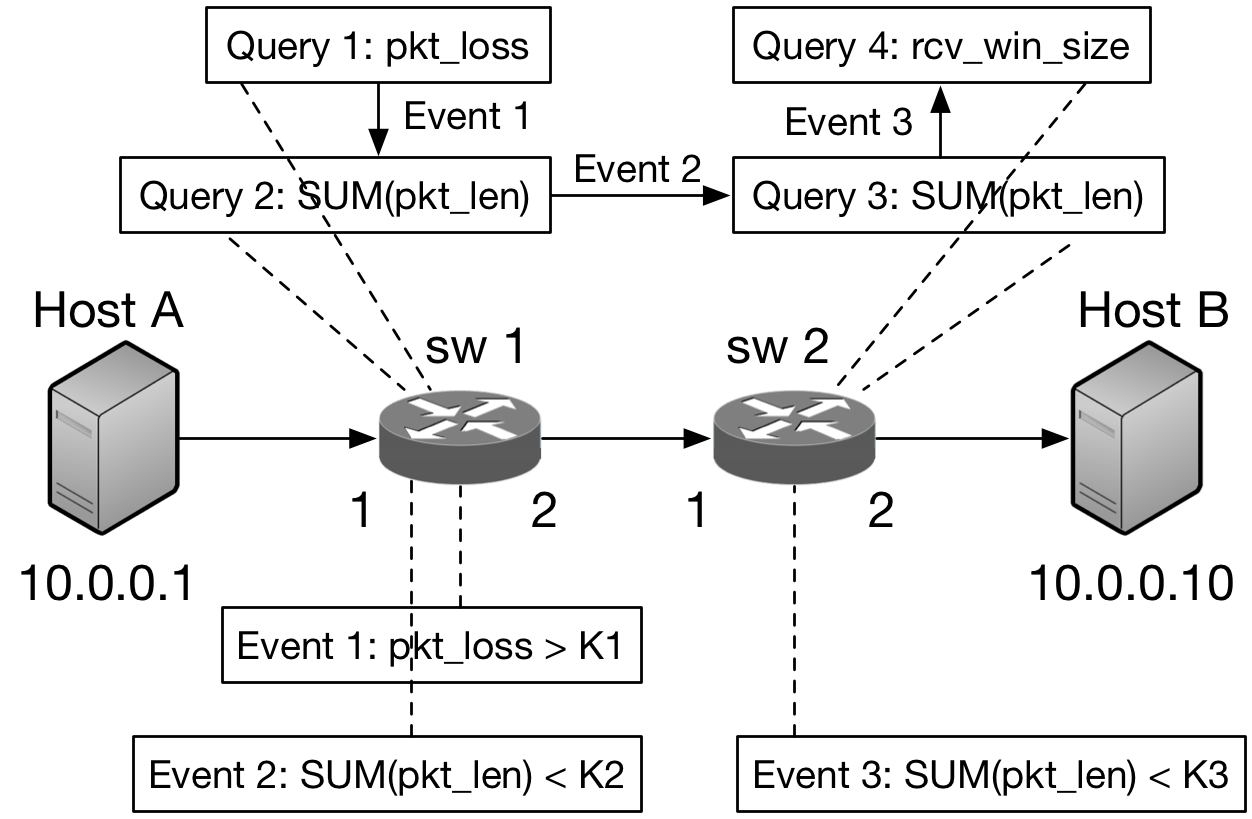
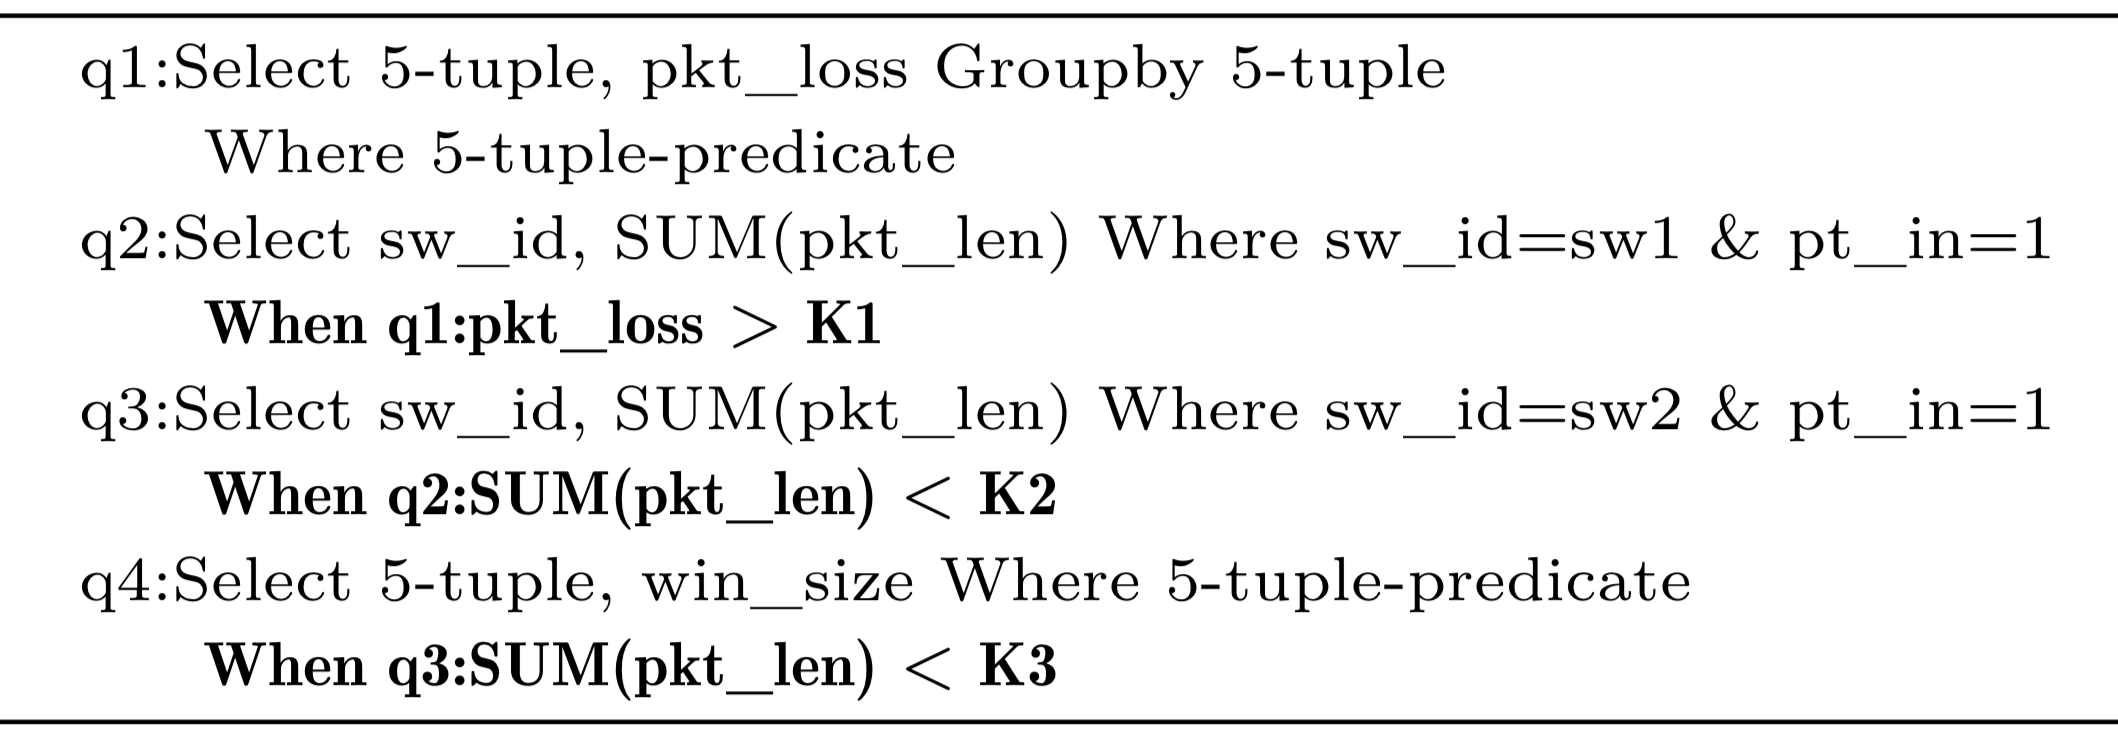
As shown in the above figure, in order to detect packet loss and its root causes along the path from Host A to Host B, the following steps should be implemented: Firstly, we should launch a query (Query 1) to measure the packet loss pkt_loss (here we define the TCP packet loss as the number of out of sequence packets) on switch sw1. To detect the specified network condition, i.e. whether the packet loss exceeds a threshold, we can define the first event “Event 1” as pkt_loss > K1, and the subsequent Query 2 will be triggered to check the throughput “SUM(pkt_len)” of links “Host A \rightarrow sw1” when “Event 1” occurs. If the throughput is normal, i.e., Event 2 occurs, and the link “sw1 \rightarrow sw2” will be checked by executing Query 3. Similarly, if this link is normal too, we will check the TCP window size (Query 4) to clarify the setting on the end-host. As a result, network operators only need to review the received events in order to localize the potential culprit, rather than comprehensively reviewing all the network-wide measurement results. This example can be described in the proposed event-driven language as:
AMIS Instrument
We design a programmable network measurement platform for line rate up to 100+ Gbps using general-purpose x86 multicore processors and off-the-shelf 100 GbE NICs with the support of DPDK[4], a high speed packet I/O library.
- The issues of existing tools include:
-
Issues using OVS: (1) The packets traversing OVS are largely less than the real throughput (around 500Mb/s when the real throughput is 25Gb/s). (2) The max speed: 10Gb/s.
-
Issues using Argus. When the throughput exceeds around 10Gb/s, Argus has the following issues: (a) Floating point exception (b) Incorrect statistics
- Speedup data processing by using multi-core (RSS) and DPDK
The Intel Data Plane Development Kit (DPDK) consists of a set of libraries, which can be used to provide high throughput packet I/O in user space, addressing the performance issues of OS kernel device drivers and protocol stacks. Nowadays, modern high-performance servers usually employ non-uniform memory access (NUMA) architecture. The DPDK supports the NUMA architecture and provides the multicore framework. The DPDK allows multiple RX queues and TX queues at the same time, which can significantly increase packet I/O performance.
Design Principle
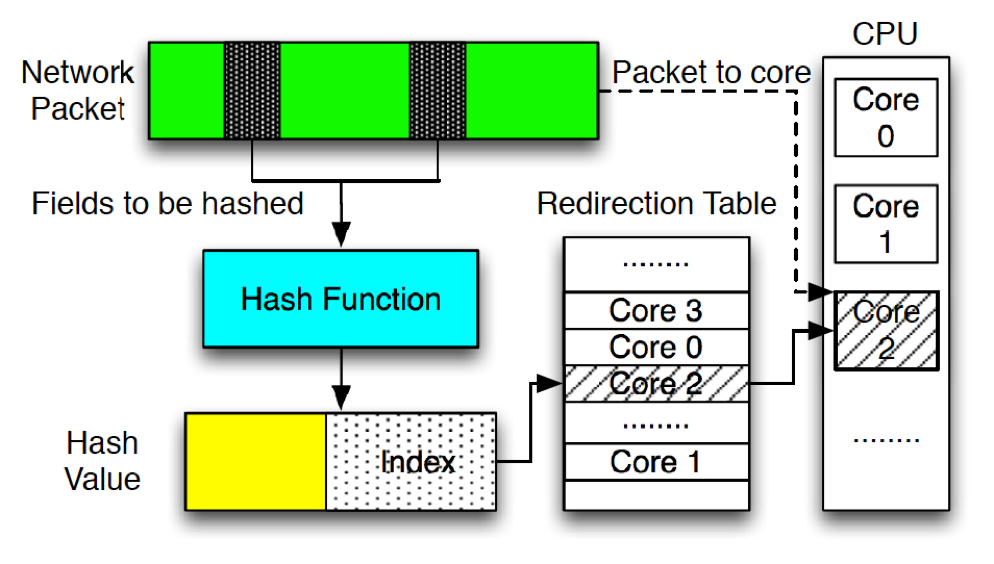
As shown in the above figure, the following steps are used to implement the RSS feature of the NIC. (1) Specify which fields of the received packet are chosen to be hashed. (2) Specify which hash function is going to be used to hash the chosen fields. (3) Choose the last 7 bits of the hash value to form the final hash value, since the redirection table has only 128 entries. (4) Find the core ID stored in the redirection table according to the final hash value. (5) By following the core ID, the received packet is directed to the corresponding DPDK RX queue.
RSS Design
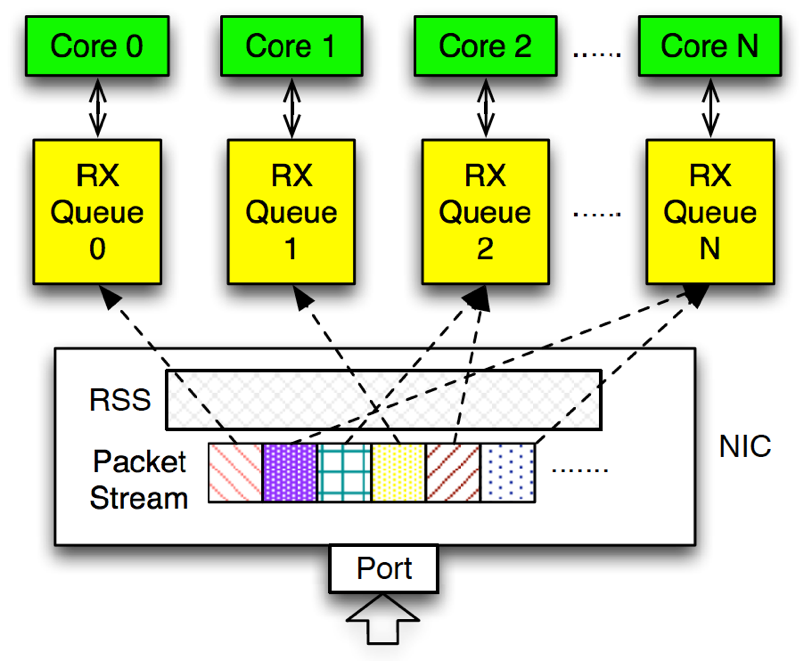
After all these setup, as shown in the above figure, multiple DPDK RX queues can be kept at the same time, and each core can receive and handle the packets from each DPDK RX queue in parallel. Since the NIC transfers each packet to its corresponding DPDK RX queue by applying the same hash function, packets within the same flow would be steered to the same DPDK RX queue.
AMIS Functions
The basic measurement functions of our DPDK based AMIS box:
- Flow filter and aggregate;
- Per-flow status report (pkt header fields);
- TCP packet loss detection according to retransmission;
- Calculating Per-flow volume;
- Packet count;
- Generating Netflow records.
More advanced measurement functions can be implemented:
- Top-K talker;
- Heavy hitter detection;
- Super-spreader detection;
- UDP flood detection;
- SYN flood detection;
- Elephant flow detection.
AMIS Measurement Fields
- Fields for Statistics
| No. | Field | Description |
|---|---|---|
| 1 | mid | measurement device/node identifier |
| 2 | srcid | record identifier |
| 3 | stime | record start time |
| 4 | ltime | record last time |
- Fields from Packet Headers
| No. | Field | Description |
|---|---|---|
| 5 | smac, dmac | source or destination MAC addr |
| 6 | saddr, daddr | source or destination IP addr |
| 7 | proto | transaction protocol |
| 8 | sport, dport | source or destination port number |
| 9 | flgs | flow state flags seen in transaction |
| 10 | stcps, dtcps | source or destination TCP base sequence number |
| 11 | stos, dtos | source or destination TOS byte value |
| 12 | sttl, dttl | src -> dst (sttl) or dst -> src (dttl) TTL value |
| 13 | sipid, dipid | source or destination IP identifier |
| 14 | smpls, dmpls | source or destination MPLS identifier |
| 15 | dir | direction of transaction |
| 16 | swin, dwin | source or destination TCP window advertisement |
| 17 | svlan, dvaln | source or destination Tag protocol identifier |
| 18 | svid, dvid | source or destination VLAN identifier |
| 19 | svpri, dvpri | source or destination VLAN priority |
- Calculated fields
| No. | Field | Description |
|---|---|---|
| 20 | spkts, dpkts, pkts | src -> dst (spkts), dst -> src (dpkts) packet count and total packet count |
| 21 | sload, dload, load | bits per second |
| 22 | sloss, dloss, loss | pkts retransmitted |
Compare with Argus
Argus[5] is a network utilization audit system which is focused on developing all aspects of large scale network situational awareness derived from network activity audit and composed of
- Real-time Network flow monitor
- Network flow data collection system
- Network flow data processing programs
- Audit data repository tools
We compare the functionalities of our AMIS box with Argus as the following table:
| Features | AMIS box (DPDK) | Argus |
|---|---|---|
| Data capture | DPDK | pcap |
| Throughput | small size: 34 Gbps; large size: 90 Gbps | ~10Gbps |
| Measurement fields | pkt header fields | pkt header fields |
| Measurement functions | Basic and advanced functions | Basic aggregate functions |
| Direction | uni-directional flow monitor | bi-directional flow monitor |
Notes
- B. Claise. Cisco systems netflow services export version 9. 2004.
- P. Phaal, S. Panchen, and N. McKee. Inmon corporation’s sflow: A method for monitoring traffic in switched and routed networks. Technical report, 2001.
- M. Balman, E. Pouyoul, Y. Yao, E. Bethel, B. Loring, M. Prabhat, J. Shalf, A. Sim, B. L. Tierney, Experiences with 100gbps network applications, in Proceedings of the fifth international workshop on Data-Intensive Distributed Computing Date, ACM, 2012, pp. 33–42.
- D. Intel, Data plane development kit, URL http://dpdk.org.
- Argus. URL https://qosient.com/argus/