Data Analytics
Overview
Visualizations Our traffic matrix visualizations are built for the web utilizing the D3 and Leaflet JavaScript libraries. The visualizations have been designed with lessons learned from E. Tufte’s “The Visual Display of Quantitative Information”. Some examples are:
- Lines between communicating entities are proportional to the number of bytes communicated; the line widths are information bearing.
- We avoid non-information bearing ink as much as possible. We do feel that, despite the large amount of ink they consume, the AS organization logos do convey a lot of information; they make organizations easily recognizable on the map.
- We provide an option to fade the background map to reduce the amount of ink it consumes.
The image below shows our traffic matrix visualization at the Autonomous System (AS) level.
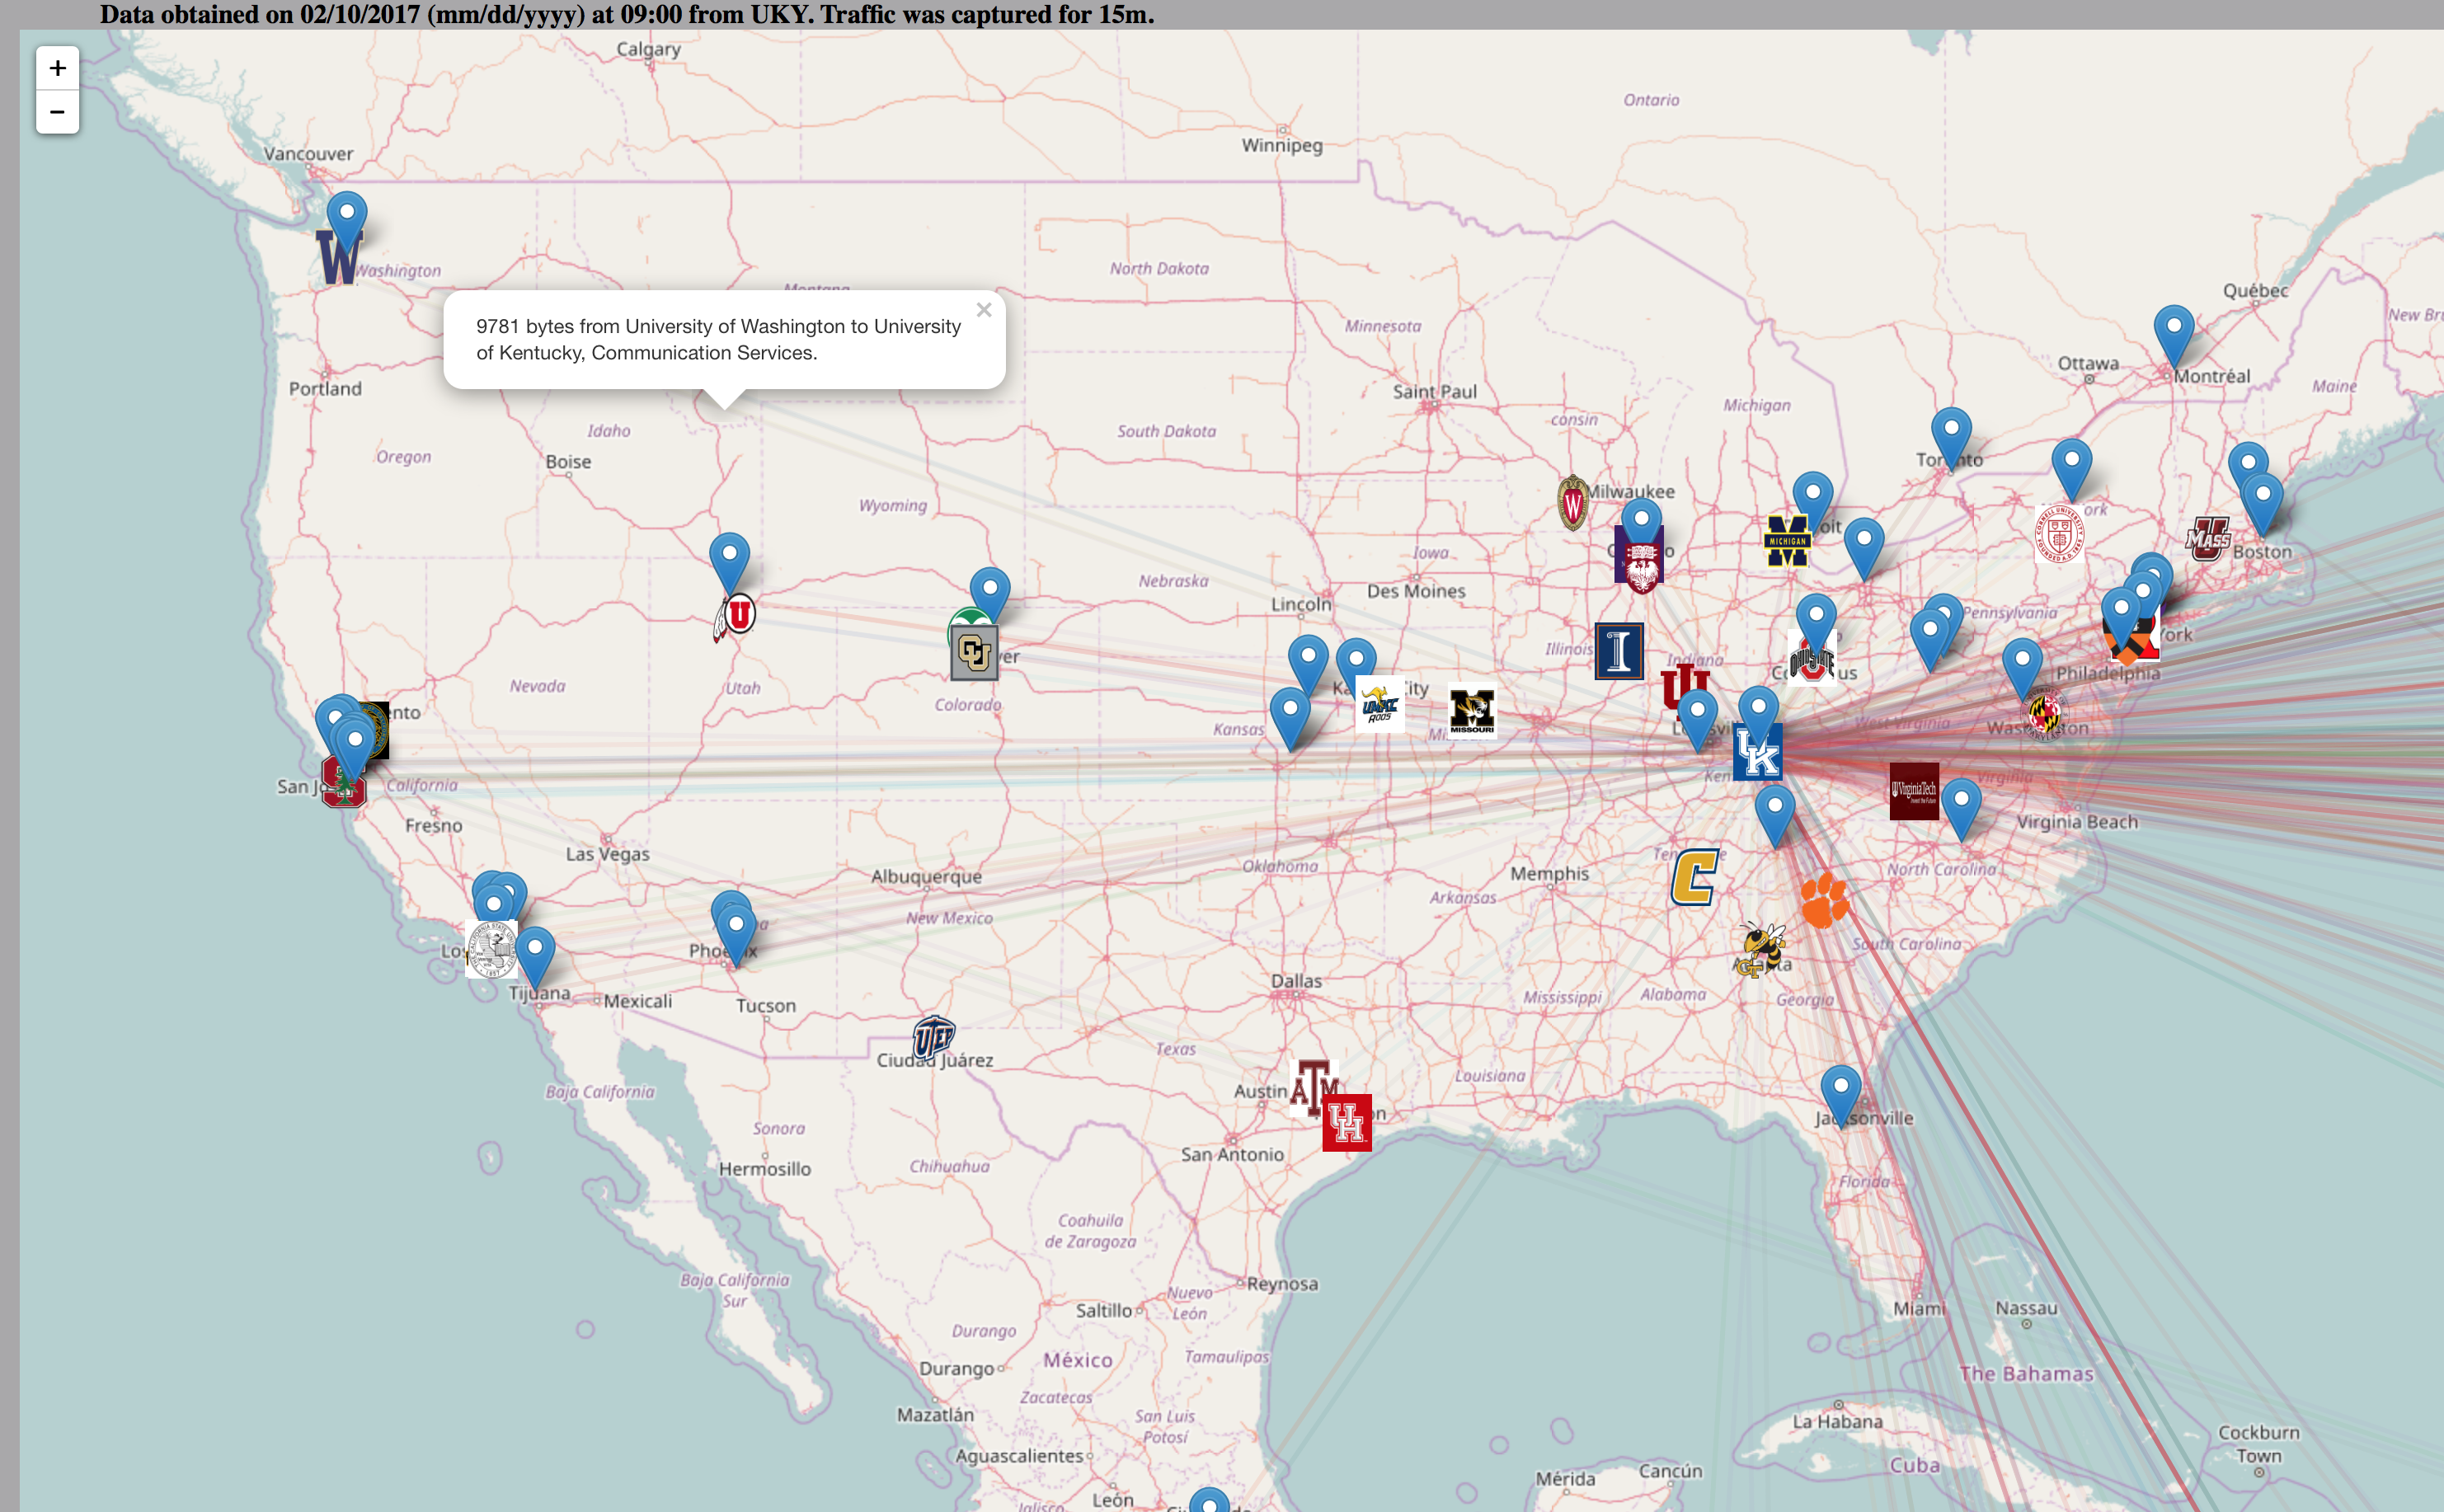
Traffic matrix visualization at the AS level
Software defined network measurement and analytics We have worked to define the functionality of the layers of abstraction for a software defined network measurement and analytics stack. We are adopting the 3-layer software defined networking (SDN) model. The figure below illustrates these layers of abstraction. The Infrastructure layer consists of the software-controlled network measurement devices (e.g., network taps, switches, PerfSONAR). The Control layer consists of the network data analytics implemented using data science software ecosystems such as Python/PANDAS, Apache Spark, and the Linux Foundation’s Platform for Network Data Analytics (PNDA). We will use the Python/PANDAS data science software ecosystem to implement the SDNM control layer. Finally, the Application layer consists of applications that automate the tasks of network operators (e.g., detect and react to intrusions, detect and correct faults) and leverage the Control and Infrastructure layers.
Our primary focus is on the SDNM control layer. This layer will contain the following categories of functionality available to the application layer:
- join network data with other sources (e.g., AS information)
- create network data aggregates (e.g., traffic matrix)
- filtering/splitting network data
- summarizing network data (e.g., bytes distributed over application)
- network event detection (e.g., detect a network fault)
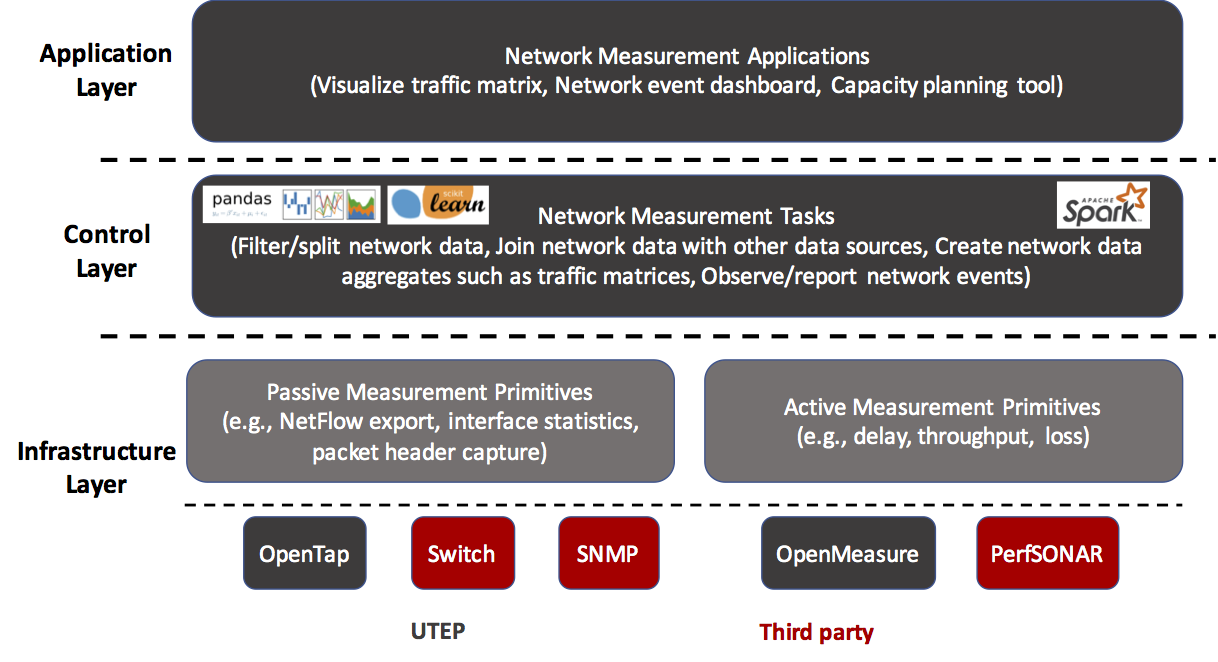
Software defined network measurement and analytics (SDNM). We adopt the 3-layer SDN model. The analytics are contained in the SDNM Control Layer
Our Python SDNM API has been implemented as a Python module. Here are the available functions:
Measurement task functions:
netflow(startTime, stopTime, version=False, flow_count=False, SysUptime=True, unix_secs=True, unix_nsecs=True, engine_type=False, engine_id=False, samp_rate=False, flowOVS=False, flowAPI=False, srcaddr=True, dstaddr=True, nexthop=False, inputif=False, outputif=False, dPkts=True, dOctets=True, first=True, last=True, srcport=True, dstport=True, tcp_flags=False, prot=True, tos=False, src_as=False, dst_as=False, src_mask=False, dst_mask=False, location, port) Create a measurement task that generates Netflow records Input: Measurement Start and Stop Time as a time.struct_time optional flags specifying which Netflow fields should be kept and optionally IP address (ip) and Port number (port) for REST API Output: Measurement Task ID
netflowGetData(taskID, location, port) Collect Netflow records from a Netflow measurement task Input: Measurement task ID and optionally IP address and Port number for REST API Output: Netflow records as a PANDAS data frame
NetFlow data load/store functions:
netflowLoad(filename)
   Load Netflow records from a CSV file
   Input:  CSV filename
   Output: Netflow records as a PANDAS data frame

netflowFlowtoolsLoad(filename)
   Convert Flow-tools Netflow records in a file format to our Netflow v5 CSV format
   Input:  Filename containing NetFlow records in flow-tools format
   Output: PANDAS data frame containing NetFlow records in our format

nfdumpToNetflow(nfdumpData)
   Convert Netflow records in NFDUMP CSV file format to our Netflow v5 format
   Input:  PANDAS data frame containing NetFlow records in NFDUMP format
   Output: PANDAS data frame containing NetFlow records in our format
netflowStore(filename, netflowData)
   Store Netflow records to a CSV file
   Input:  CSV filename
           Netflow records as a PANDAS data frame
   Output: Error code from to_csv() PANDAS method
Event detection functions:
netflowDetectSSHIntrusion(netflowData)
   Detect system intrusions via SSH in NetFlow data (uses SSHCure rules [University of Twente])
   Input:  Netflow records as a PANDAS data frame
   Output: A dicitonary containing data regarding the SSH system intrusions detected #### Join functions:

annotateNetflow(netflowData)
   Annotate Netflow records with AS and geographic information
   Input:  Netflow records as a PANDAS data frame
   Output: Annotated Netflow records as a PANDAS data frame    netflowAddApplication(netflowData)
   Adds application data to Netflow records
   Input:  Netflow records as a PANDAS data frame
   Output: Netflow records (with application data) as a PANDAS data frame #### Aggregation functions:
trafficMatrices(netflowData) Create a dictionary of traffic matrices (continent, country, AS) from Netflow records containing AS and geographic information Input: Netflow records as a PANDAS data frame Output: Dictionary with traffic matrices and label indices
Summary functions:
netflowSummary(netflowData)
   Summarize NetFlow data (byte distribution over applications/institutions)
   Input:  Netflow records as a PANDAS data frame
   Output: Dictionary with byte distributions #### Utility functions:

ipLookup(ip)
   Lookup AS number and geographic data for an IP address using local TCP service
   Input:  IP address in dotted decimal (string)
   Output: A dictionary with IP address data: 'orgname', 'asnum', 'latitude', 'longitude', 'city', 'region', 'country', 'continent'
appLookup(port, prot)
   Lookup application name using port number and IP protocol number
   Input:  Port number and IP protocol number
   Output: Application name (string)